2056

Author
Meat.Milk
Share on


Published on
2023 June 22
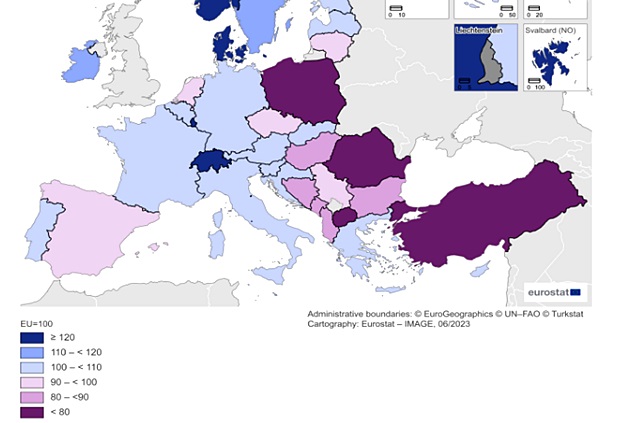
According to the latest analysis conducted by Eurostat in 2022, price levels for food and non-alcoholic beverages were 21% above the EU average in Denmark and Luxembourg, and 28% below average in Romania.
Hungary had the lowest price level for alcoholic beverages in the EU in 2022, being 18% below the EU average, while Bulgaria was the least costly for tobacco (51% below the EU average).
Price levels
Price levels for food, beverages, and tobacco vary considerably across EU member states. In 2022, prices for food and non-alcoholic beverages in Denmark and Luxembourg were 21% above the EU average, while in Romania, they were 28% below the EU average.
Non-alcoholic beverages were more expensive in Denmark, being 39% above the EU average, and least costly in Romania, being 20% lower.
The price of alcohol in Finland was 114% above the EU average, while in Hungary, it was 18% lower. For tobacco, the highest prices were observed in Ireland (159% above the EU average), while the lowest were recorded in Bulgaria (51% lower).
The survey results are expressed in Price Level Indices (PLIs), which provide a comparison of price levels among countries relative to the EU average. Map 1 and Figure 1 show the PLIs for food and non-alcoholic beverages in 2022, while the tables present the PLIs for product subgroups.
Switzerland is the most expensive country for food, Norway for non-alcoholic beverages, Iceland for alcoholic beverages, and Ireland for tobacco among the group of 36 participating countries. Among EU member states, Luxembourg is the most expensive country for food, Denmark for non-alcoholic beverages, Finland for alcoholic beverages, and Ireland for tobacco.
Romania has the cheapest food in the EU
The least costly countries among all 36 are Turkey for food and tobacco, North Macedonia for non-alcoholic beverages, and Hungary for alcoholic beverages.
Among EU member states, the lowest price levels for food and non-alcoholic beverages are observed in Romania. Alcoholic beverages are least expensive in Hungary, and tobacco is least expensive in Bulgaria.
Price dispersion is most pronounced within the group of 36 countries, including both high-price EFTA countries and higher-priced Western Balkan countries.
The lowest price dispersion is found for non-alcoholic beverages, and the highest for tobacco, mainly due to significant differences in excise duties on these products across the 36 countries. Price dispersion is much less pronounced in the euro area than in the EU as a whole.
Price levels for bread and cereals, meat, fish, and dairy products
The survey results also provide insights into different product subgroups for all participating countries. Table 2 presents the PLIs for four food subgroups: bread and cereals, meat, fish, and dairy products.
These four subgroups represent on average 17%, 23%, 5%, and 16% of household food expenditures, respectively. For comparison, this table includes the PLIs for food overall.
Among all 36 countries, Switzerland has the highest price level for bread and cereals, meat, and fish. Iceland is the most expensive country for dairy products (milk, cheese, and eggs).
Within the EU, Denmark is the most expensive country for bread and cereals and for fish, Luxembourg for meat, while Greece is the most expensive for dairy products (milk, cheese, and eggs).
Among all 36 countries, Turkey is the cheapest country for bread and cereals, meat, and fish. The lowest price level for dairy products (milk, cheese, and eggs) is observed in Poland.
Among EU member states, the lowest price levels for bread and cereals and for meat are observed in Romania. Fish has the lowest price level in Bulgaria, while Poland is the least costly country for dairy products.
The level of price dispersion is quite similar across these four subgroups. Meat exhibits the highest price dispersion in all country groups. In the EU, the lowest price dispersion is found for dairy products (milk, cheese, and eggs).
Price levels for oils and fats, fruits, vegetables, potatoes, and other food products
These subgroups represent on average 4%, 22%, and 14% of household food expenditures, respectively.
Among all 36 countries, the highest prices for oils and fats are observed in Switzerland. Norway has the highest price level for fruits, vegetables, and potatoes, as well as for other food products.
North Macedonia has the lowest price level for oils and fats, while Turkey is the least costly country for fruits, vegetables, and potatoes, as well as for other food products.
Among EU member states, Malta is the most expensive country for oils and fats, Luxembourg for fruits, vegetables, and potatoes, and Denmark for other food products.
Italy is the least costly country for oils and fats, Romania for fruits, vegetables, and potatoes, and Poland for other food products.
Within these three subgroups, the highest price dispersion can be observed for fruits, vegetables, and potatoes.
Purchasing Power Parities
Purchasing Power Parities (PPPs) are price relations that show the ratio between prices in national currencies of the same good or service in different countries. For example, if the price of a hamburger in Sweden is 28.60 Swedish krona, and in Italy, it is 2.76 euros, the PPP for hamburgers between Sweden and Italy is 28.60 krona to 2.76 euros or 10.36 krona per euro.
In other words, for every euro spent on hamburgers in Italy, 10.36 krona would need to be spent in Sweden to obtain the same quantity and quality - or volume - of hamburgers.
(Published PPPs usually refer to groups of products or broad aggregates such as Gross Domestic Product (GDP) rather than individual products. However, these aggregate PPPs are based on sample surveys of individual goods and services.)
Did you learn something new from this article?
Read also: